I thought it had been a longer time, but it was just a few months ago that we were discussing the UK “vaccine” surveillance data and how it was showing that jabbed individuals seemed to be more likely to get infected.
(Data is here: https://www.gov.uk/government/publications/covid-19-vaccine-weekly-surveillance-reports)
I observed that:
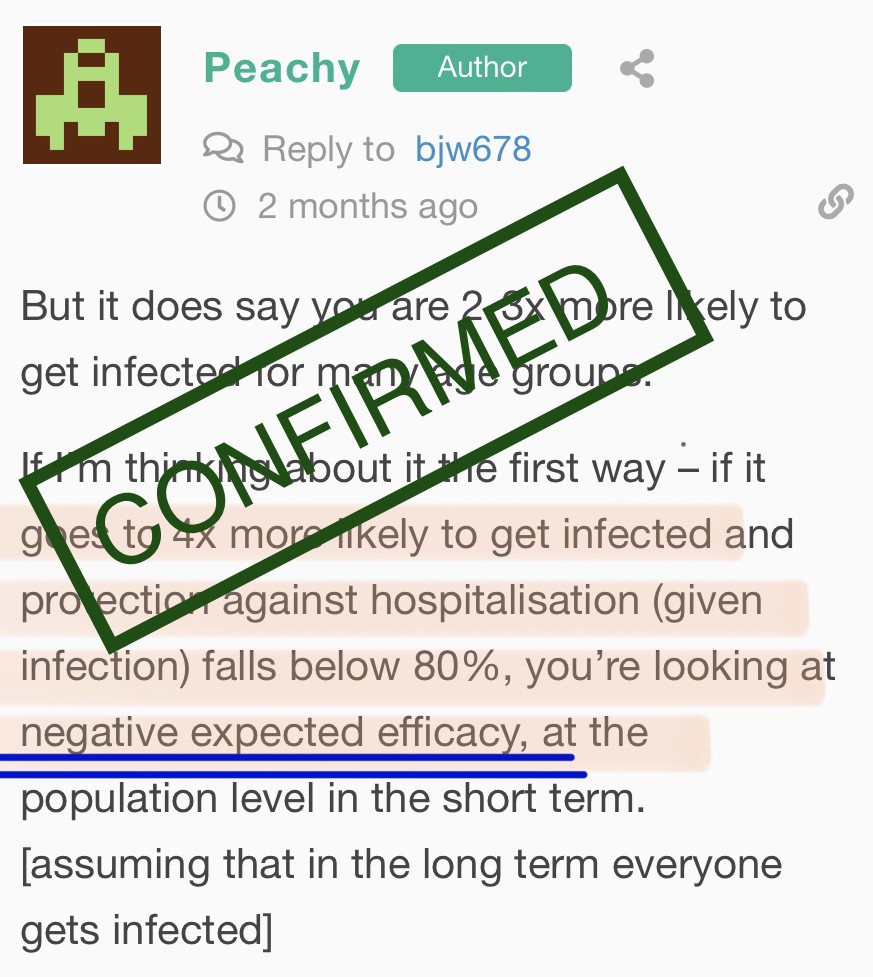
If I’m thinking about it the first way – if it goes to 4x more likely to get infected and protection against hospitalisation (given infection) falls below 80%, you’re looking at negative expected efficacy
(https://www.ezfka.com/2022/01/17/how-many-ezfka-kids-will-be-delivered-up/#comment-18378)
I finally got around to seeing how this has turned out…
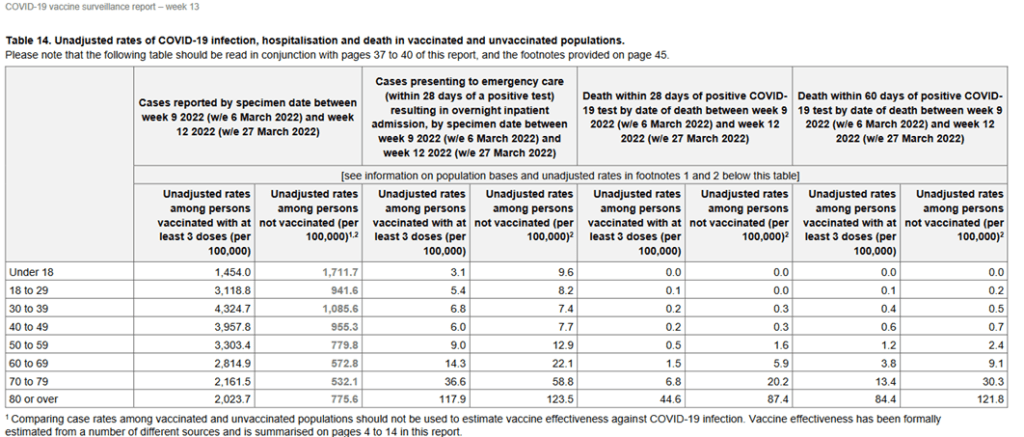
Now, for those who have looked at this before, the data is published weekly, is presented as rates per 100,000 population, and looks at infections, emergency admissions and deaths within 28 or 60 days it is stratified into age groups looks like this:
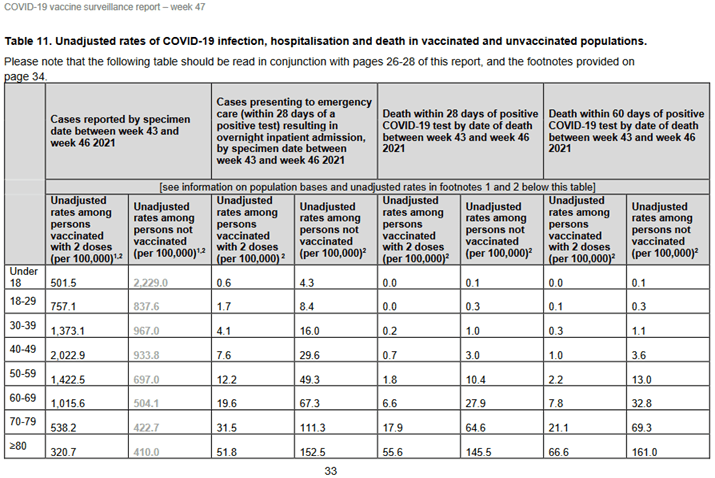
Just by looking at this example, you can clearly see that the jabbed are more likely to end up covid positive in many age groups, but also less likely, once infected, to end up in emergency or dead.
With the odds of getting infected being bad and the odds of not dying being good, it takes a little bit of arithmetic to work out whether, in total, being jabbed makes a bad outcome from covid more likely or less likely.
So I’ve gone and done a bit of arithmetic to see what the data say about the overall chances of the jabbed and how it has changed over time. Each time i present the underlying data and my calculations.
starting back in the good old days – week 47 of 2021:
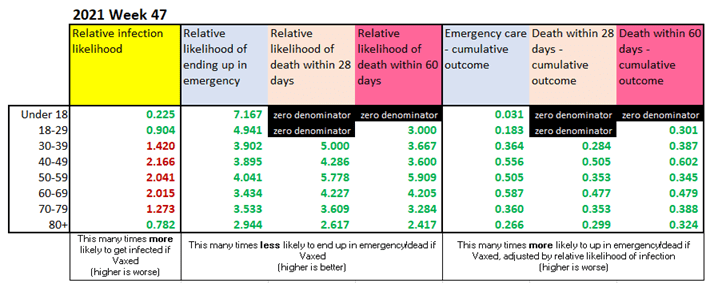
To explain the arithmetic:
- the numbers in the first block are calculated by dividing the infection rates of vaccinated by unvaccinated (e.g. for 40-49 group: 2,022/933 = 2.16)
- the numbers in the second block are calculated by dividing the emergency/death rates of unvaccinated by vaccinated (e.g. for 40-49 group going to emergency: 29.6/7.6 = 3.89)
- the numbers in the third block are calculated by dividing the first number by the second (2.16 / 3.89 = 0.55).
so in this case the fact that one is about twice as likely to get infected, this is more than offset by the fact that one is about 4 times less likely to end up in emergency once infected.
The colour coding is simple – green is good (for the jabbed) red is bad (for the jabbed).….and the numbers are looking pretty green overall that week – somewhat higher chance of infection is well offset by notably better outcomes for the infected in all categories.
Then we look at week 10 of 2022…..:
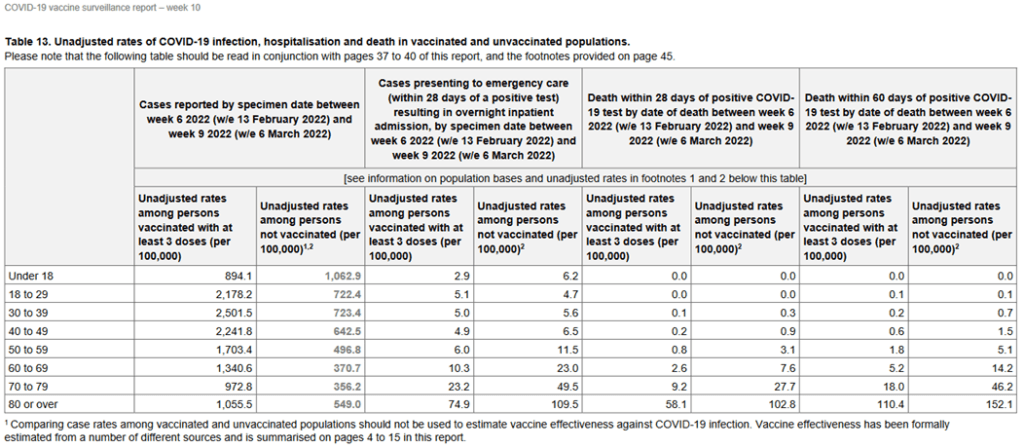
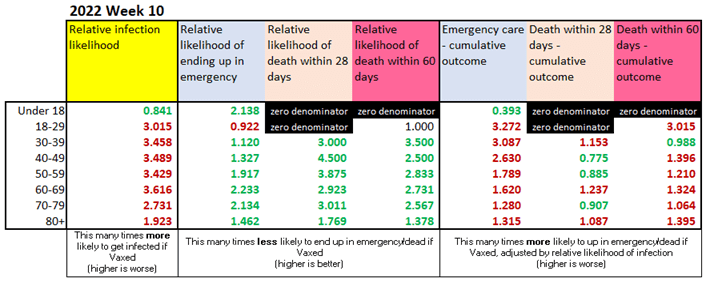
a lot of red is creeping in – now almost all age groups are more likely to get infected if jabbed … and not just a bit: 3+ times more likely. And this effect begins to overpower the protective power of the jabs against hospitalisation and death (this protective effect is also getting weaker).
Then we get to week 13 of 2022:
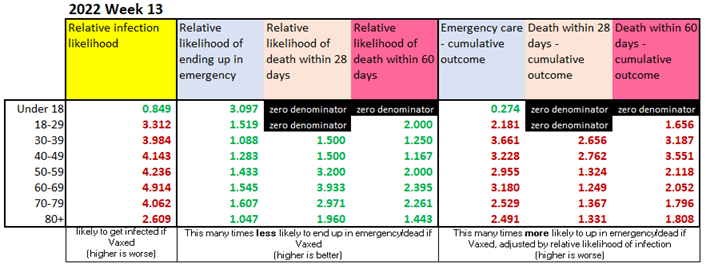
and its a sea of red, a fucking disaster! It is CLEARLY FUCKED! In all age groups and across all bad outcomes (icu and death) the jabbed are significantly worse off overall. Very significantly likely to get infected and only moderately better off after infection, adding up to a net negative effect.
It is teh flippening! It seems to have turned just like i had prognosticated – risk of infection for the jabbed hit 4-fold and vaccine efficacy faded below 80%. Yeah!
now, just watch what happens next week…

And what appears is a lame excuse!
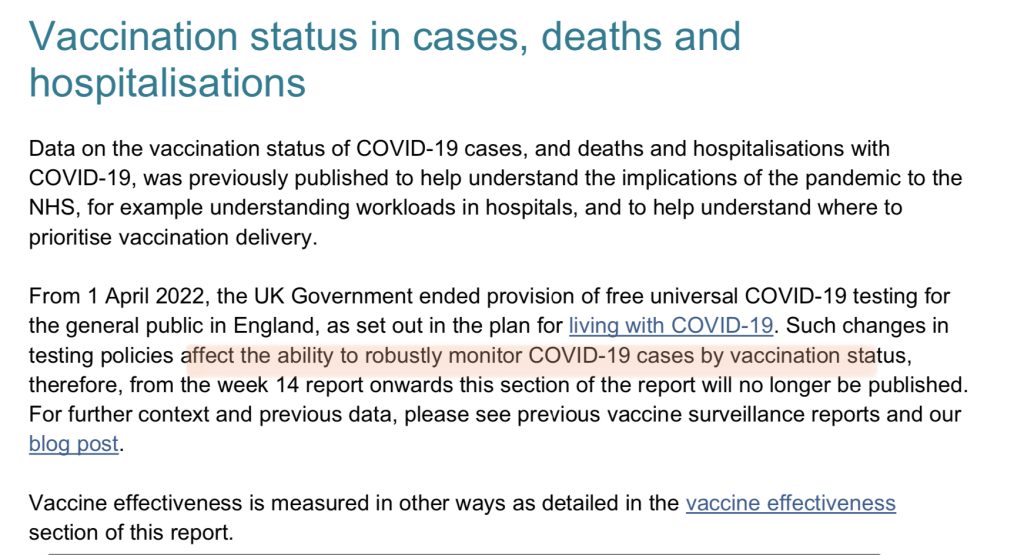
as if they don’t bloody know whether folks admitted to emergency or morgue are covid positive or not….
yo where are all the piccies
its bc the vax apparently suppresses your immune system after you get it, making you more susceptible to disease
I think I fixed the pictures now.
mhhhhmmmm – that doesn’t sound like the sort of thing that I want from my vax 🤨
The next question is, for how long?
We will begin see some clues in the aggregate mortality data and insurance statistics(and premiums) I think.
I believe someone was working to put up a post about this, but it’s not up yet, or has been taken down, or something.
it was me
I decided to delete it because of paranoia
Can you please delete all my previous comments
Even better if comments all automatically disappeared after a month
Basically, it shows that neither the virus nor the jab seem to have had any effect on excess mortality, but there is some bizarre shit happening as WA and SA (who had zero covid for all of 2021, as well as the lowest vaccination rates) had excess mortality several SD above expectations
paranoia is great.
EZFKA doesn’t have the fancy tech to delete comments, let alone automatically. Because of too many freeloaders.
but there is tech that scrubs/does not retain ip addresses for comments. Thanks to Stew’s earlier tantrum…
hmmmmm… seems like WA and SA both have a Labor government and that’s why they’re fucked. 🤭
like 2 weeks i think
Been trying to share some of these articles but it appears the preview tab for social media isn’t generating.
Something it department can fix it is it just me.
This correlates with the study in the Netherlands from mid last year as well as the study in Israel too.
Another scary statistic is that according to NSW health data, presented by Sen Gerard Rennick, showing that 70% of pregnant women are suffering miscarriages since the jabs were rolled out vs the long term average of 25%
The great depopulation plan is well underway
rubbish!
if you input the undetected covid cases into the equation the numbers become positive for jabbadabba-do’s and bad for jabbadabba-donots
from article it is clear that the data is obscured by the asymptomatic infections dwarfing the numbers of unjabbadaba which clearly indicates that the virus was so bad and rampant we had to do something, like lockdown and mandate jabs-(f)or-jobs. Now that 97.834% are jabbed, the chance of having asymptomatic infection are less than Zero and no one risks death from the asymptomatic infection. Science, silly.
https://www.news.com.au/lifestyle/health/health-problems/a-doctor-explains-why-you-havent-caught-covid-yet/news-story/d57a08a08278abf27f43c29fcfe87196
its actually the opposite with peachys pantented statistical analysis. If we add more jabbadabbados with asymptomatic Covid, then we actually dial up even further their relative likelihood of being infected.
what a disgrace, hey? The trouble that they have with the narrative at present is a standard basic thing – if you tell too many lies and untruths, it quickly becomes very difficult to maintain them all and have some kind of internally consistent narrative.
Is that sarcasm? Honestly, I really can’t tell. Appealing to data that doesn’t exist has to be the absolute pinnacle of bullshit.
rubbish.
news dot comau has been the absolute pinnacle of veracity. the science behind the claims is supported by experts in science and fact checked
yeah, nah
don’t think you can draw the interpretations you have from the data
For starters, people getting the jab are
a) more likely to get tested for covid
b) more likely to have underlying medical conditions
This means they will generate far more positive test results per capita
AND
They are more likely to die (with/from covid) within 28 days of said positive test results ( because they are more likely to die of all causes anyway because of their medial conditions)
You need to control for these variables, which this data does not
Basically I think this is a bit of paranoid nonsense
For sure the jab is unnecessary in young people, and probably slightly overall worsens mortality but its going to be a detrimental effect in the order of 1-2 per million if that.
I think you should look at ABS excess mortality data for 2021
Basically shows that despite all the circulating covid, NSW was at expected mortality (no excess deaths) – proving that covid threat is now grossly overblown but so is the anti-vax propaganda (as NSW was the most heavily vaxxed state)
But it also shows that for some reason, WA and SA were way above (8% several standard deviations) expected mortality, despite having ZERO circulating covid and lower vaccination rates
Completely inexplicable, and the ABS just casually ignored the issue in their summary of the results
https://www.abs.gov.au/articles/measuring-australias-excess-mortality-during-covid-19-pandemic
im not saying my analysis is the best, but your objections don’t really hold up – Not with the very significant vaccine take-up levels in the population.
Over 70% for those over 20; 90%+ for the oldest cohorts.
what are you suggesting that this means?
I have no idea what you are implying – yes vaccine take up is high. How does this affect my interpretation?
WITHIN each age group, but especially the younger, the people who are sicker are more likely to get the jab, and more likely to die
They’re more likely to get the jab BECAUSE they have underlying conditions, and are at more risk of dying from covid as well as more at risk of dying from all causes (because of their comorbidities)
Also, people who get the jab are more likely to get TESTED, either because theyre hypochondriacs or because they have good reason to be concerned about getting covid (comorbidities)
the point I am trying to make is that what you describe might be true if you have jabbed 30% or so of people. Due to self-election, etc, you can validly presume that you’ve got the sicker people and the hypochondriacs, etc.
but when you’ve jabbed 90%+ [especially when you had coercive measures like no-jab:no-pub and vicious scare campaigns], then the presumption is actually the opposite. The presumption is that you have covered a very representative sample of the population. And the onus of proof must be on someone who wants to make some special claim about the attributes of the remaining 10%.
not at all true
In fact, the opposite might be the case
For example, if there is only 10% unjabbed, I will assume that those 10% consist almost entirely of conspiracy theorists and social outcasts, who are very, very unlikely to get tested
yes, that might be, but it’s up to you to prove that this is the case.
…Just like Descarte’s demon might cause you to make a mistake every time you count the sides of a square, such that you erroneously conclude that it has 4 sides… it is imaginable, but probably not a sensible starting point.
i mean you are the one making the assertion in the first place
the 2021 mortality data shows it probably has not made a difference
my assertion is that you can’t claim that 90%+ of the population (or each age group) are particularly morbid, hypochondriac or otherwise particularly predisposed to getting sick and dying. That is plainly ridiculous!
fwiw, I have perused the studies that look into the characteristics of the unjabbed. There is stuff in there about lower education level, less likely to be married (?!), poorer, less access to services/medicine, ethnic markers. And yes, some good-old-antivaxers.
nothing in that suggests to me that they are the hyper-healthy mega-resilient sorts. If anything – probably the opposite.
oh yes, we can’t forget the fact that your baseline chance of dying with Covid (ie death, given recent infection) is <0.2% unless you are quite old.
Chance of dying from Covid is even lower.
I can assert with relatively high degree of certainty that the 10% who have stubbornly refused the jab will also stubbornly avoid getting tested
I don’t think any reasonable person would refute that
I also believe I can reasonably assert that the same 10% of objectors are more healthy overall than the 90% who are jabbed
This is perhaps debatable, but I can imagine far more reasons that very healthy/pure people would be willing to reject the vaccine than vice versa
The fact that its a small cohort affects your interpretation as much as it does mine
why? why can you assert that with confidence? What is your evidence, or at least anecdata?
No, I don’t think so. I think that the laws of large numbers are against you here. With 90% coverage, you are guaranteed to have all sorts in there, with the skewness due to the high risk population (which I acknowledge is there) diluted down to general-population levels by everyone else.
the research on the unvaxed suggests that they are generally poorer/dumber/more ethnic, etc. this is different to your assertion.
common sense
but im sure if we did a study we would find the same thing
For instance, how many covid tests have you taken? and are you vaccinated?
Not true, everyone I know that is a pure blood including me has had a test at some stage, whether for work or to check that we have whuflu.
how many tests?
I myself have had one test
I know plenty of triple and quad jabbed lunatics who have had dozens of tests
My sons school sends us 5 a week – im sure some parents use them all up
Now you can imagine why the covid fanatics are more likely to generate positive tests
um, not quite. not at all.
why take the jab if you will end up in quarantine when positive.
the peddling of jab=Superman has been strong and causes negative motivation towards testing.
jabbadabba-do’s are less likely to test because of inconvenience
Let’s continue our clinical study
Please answer the following questions
have you been jabbed?
how many covid tests have you taken?
LOL, I’m the worst case for your cause.
I am naturally immunised and pureblood, tested probably about 20 times in the second half of 2021 and approx the same in this year, as recent as last Monday. I need this for work in hospitals and to take my immunocompromised father for chemo. BTW, my pureblood father had the “bad flu” with even less symptoms than myself. go figure
I will test at mildest suspicion of flu like symptoms as it leads to
64 months escape from asylum and i fear not reinfection experiencing it as just an average flu with few extra symptoms. every day 2000IU vit D, 1mg vit C, Zinc… it seems it worksmy anectdata supports the logical conclusion that jabbed will pass everything less than a hospitalisation as a common flu hence not test. the scare of home isolation is obviously higher than the scare of the virus and there is little motivation for anyone to test. there is literally no upside for jabbadabba-do’s to test, only downside.
none of the jabbadabba-do’s I know tested ever since the inocculation. I claimed this would happen last year much before the rats… if they test positive it is cognitively dissonant with their forced expectations from a vaccine…
Your formula does not change the fact that unvaxxed are more likely to end up dead or with serious illness.
I will also put it to you that a recalcitrant to who refuses to get vaccinated is also less likely to get themselves tested after they encounter a few sniffles. Your new formula does little more than measure that behaviour. Whereas as those presenting to hospital with serious illness are all being tested.
see my response to coming on this: https://www.ezfka.com/2022/04/11/as-expected-negative-efficacy-or-spurious-statistics/#comment-21531 …I say it’s something that you need prove, given that almost everyone IS jabbed.
my formula is actually just an application of the most standard risk management matrix – measuring the dimensions of likelihood of event and severity of consequence.
my suggestion is that perhaps the very significant increase in likelihood has gone and overwhelmed the moderate reduction in severity.
My response would be similar to Coming’s. You haven’t proven anything.
Even if more vaccinated people ended up with sniffles (which they don’t) then who really gives a fuck?
I think you should be barking up the myocarditis tree. Come up with stats to prove the vaccine does f/a for young people, and more stats to show incidents of heart-related issues by age and vaccination status.
of course I have proven something. And I have done it in a very simple way. The arithmetic doesn’t lie.
and, importantly, its something that ties into my earlier forecast.
Ah, that is a different project, though! My project was to show that the vaccine does nothing even for Covid at the population level in terms of hospitals not being overwhelmed or whatever.
any damage it does on other fronts (which it absolutely must do – you can’t administer 3 billion doses of experimental drugs and not end up with lots of people who suffer some adverse outcome) is over and above the covid futility.
your initial claim was that the vaccine predisposes you to being infected
the reason you can’t draw this conclusion from the data you have cited has been pointed out to you
the reason you say I can’t draw this conclusion is that “you suppose that the 10% are very special people”.
to which I say “bollocks” and the studies that I have skimmed agree with the “bollocks” assessment.
go on then, why don’t you present these studies?
Uk: https://www.ons.gov.uk/peoplepopulationandcommunity/healthandsocialcare/healthandwellbeing/bulletins/coronavirusandvaccinehesitancygreatbritain/9august2021
….black unemployed muslims from deprived areas…
USA: https://www.census.gov/library/stories/2021/12/who-are-the-adults-not-vaccinated-against-covid.html
Adults who had not received any doses of the COVID vaccine differed from those who had received at least one dose of a COVID vaccine across several measures.
…under-50, uneducated, unmarried (losers?)…
australia: https://journals.plos.org/plosone/article?id=10.1371/journal.pone.0248892
…religious women in poor areas….
these are not portraits of hyper-fit wealthy supermen, mate.
hang on
the entire premise that your theory hangs on is that the jabbed are more likely to catch covid
My counter-argument is that the numbers are spurious because the jabbed are more likely to get tested, and therefore will generate more positive test results
How does any of the statistics you’ve just vomited refute that?
You seem to be saying that
are somehow systematically less likely to get tested for covid. That’s why the infection rates look high for the jabbed.
yeh, that makes great sense!
where is your evidence?
lol you have no idea how causation and correlation work
Anyway I’m not interested in discussing it with you at this point
You are fixated on your beliefs just like covid fanatics
I’m no great proponent of the jab for healthy young people, but this is absurd
I’ve responded to all your questions. You, however, not provided any evidence.
i think you are conceding… in your white man-way.
🪞
Hahaha great point!
The data is from the ONS is right there, showing the far greater number of jabbed getting infected vs pure bloods
jesus fucking christ
THE JABBED ARE MORE LIKELY TO TEST POSITIVE BECAUSE THEY ARE MORE LIKELY TO GET TESTED IN THE FIRST PLACE
it isn’t that fucking complicated
Let’s create a poll
Are you vaccinated?
How many covid tests have you taken?
You’re making some wild assumptions there. Do you only follow ‘the science’ or ‘the numbers’ when it suits you?
Voluntary testing for covid is not scientific. It would need to be randomised testing to avoid behavioural biases.
Someone who doesn’t even believe the virus exists will definitely not take time out of their day to get tested. Whereas a hypochondriac would probably get tested even with the slightest of symptoms. That is not meant to be a scientific statement. It is meant to be commonsense to highlight the likelihood of behavioural biases and the importance of proper randomised testing.
it isn’t that fucking complicated.
it is.
because assessment that they are more likely to test is inadequate and unsupported with logic.
I replied above which applies here: what is the upside for jabbadabba-do’s to test at any symptoms? the motivation is absolutely negative for all as confirmation on positivity means sfa.
there are plenty a downsides.
×
people nowaday are likely to test only for practical reasons. I rat test sometimes 2 times a day as some hospital departments requires this prior to entry and irrespective of jabbadaba status.
Rubbish, there is no data to support your claim.
I’m unvaccinated and have been tested several times. Of the small number of unvaxxed people I know, all of them have been tested a few times.
Basing your argument on an assumption that unvaxxed people are less likely to be tested seems bogus to me.
NSW Deaths by age and vaccination status from Jan 1 to April 12, 2022.
Compiled from NSW Health daily updates.
22% of deaths are unvaccinated despite less than 4% of the population being unvaccinated. The vaccine is pretty good hey.
A cursory glance at the data might suggest that, Freddy.
But I think you might find that the situation is somewhat more nuanced than that.
Have you noticed that the number of Unvaccinated deaths (340) is very close to the combined totals of 90 and 100 year olds (386).?
You might also notice that the combined number of 2 and 3-dose deaths (1134) is closely aligned to the combined totals of the 60-80 year old deaths (1045).
It’s quite possible that we may be looking at two entirely different risk groups here.
The daily NSW Health update contains a standard statement every day:
Older age….and underlying health conditions…..possibly a recipe for being unvaccinated……and for being more prone to dying from anything untoward.
Put simply, it’s possible that some (if not many) of those who died unvaccinated were going to die anyway, vaccinated or not.
I don’t think that we do an autopsy on every 90 or 100 year old to determine if Covid was actually the cause of death.
Unfortunately, the data does not provide a link between age and vaccination status.
So I guess we will all have to draw our own conclusions.
yes, this (unvaccinated include many “end of life” type people) has been claimed for sure. But old mate coming claims the opposite – that unvaccinated are all bulletproof supermen….
what would be really good is some kind of data 😉
Vaccines were recommended and prioritised for sick and elderly over a year ago. How many of those “end of life” types would still be alive and unvaccinated a year later?
I’m just repeating what I have read. These claims were made, quite seriously.
Interesting that you want a more nuanced argument after someone points out the unvaxxed are now overrepresented in the general stats. The last time we had this discussion you were quite happy to stick to the general stats when the unvaxxed were dominated by children.
And your nuanced argument is actually the opposite of reality. The sick and elderly received priority vaccination, and have close to 100% vaccination.
COVID-19 data and statistics | NSW Government
Yes, this is the bit that they gloss over in the reporting, a large portion of the unvaccinated deaths are people that are too close to death to get the jab, this distorts the figures, as evidenced by the UK figures this trend will change as the years go on and the vaxed get old and die.
TBH, if you want accurate figures you really need to look at the sub 65 category, as older than that there are so many other factors that can lead to death that can obscure the figures.
A good example of this is that in the UK, of the 153k that were reported to have died with whuflu, only 17k actually died of whuflu, with a average age or 83 where the average life expectancy in the UK is 81.
RLM
I have followed up on that excellent point – thankfully there has been some useful data buried in the verbiage of the NSW Daily Report.
See the post below.
Tks.
Are that still counting people who were juiced within 14 days as unvaxxed? This would explain some of the ‘unvaxxed’ deaths as 80% of vax deaths occur in the first 14 days.
Yes and in some cases those that have not had the 3rd jab as unjabbed too, notably nursing homes.
Total Covid deaths in Australia from the first recorded death (March 1, 2020) until April 11, 2022.
Total deaths recorded from March 1, 2020 until December 31, 2021 (22 months) – 2,353.
Deaths recorded from Jan 1 to April 11, 2022 (3.5 months) – 4,216.
Total deaths for the entire period – 6,569.
Deaths recorded in the first 3+ months of 2022 are 180% of the deaths recorded in the preceding 22 months.
Vaccines seem to be working a treat.
https://www.worldometers.info/coronavirus/country/australia/
I guess they couldn’t get the boosters in arms fast enough?!
I’m blissfully happy at being a pure blood. Who knows what the long term consequences of these bloody drugs will be, particularly on fertility.
According to a FOI on NSW health data done by Sn Rennick, 70% of pregnant women are having miscarriages after the jab rollout, up from a norm of 25%
Have you got a link to where this 70% thing is from. That sounds waaaaaay too high to be accurate. Shirley!
I would have to look but it was a video on Sen Gerard Rennick’s FB page, where he was questioning the health officials in parliament or something, you know where they all ask questions of officials who talk around the answer and say nothing really.
As previously posted, the best charting I’ve seen re the UK Vaccine Surveillance data is as follows:
https://public.tableau.com/app/profile/t.coddington/viz/UKReportsRiskRatios/UKCharts
That said, I’ve not read this thread yet, but was thinking that link would help discussion.
Reus’s Large Member raised (sorry) an interesting point.
As luck would have it, NSW Health, starting January 15, 2022, began including a more detailed analysis of deaths under 65 in their daily report.
A typical example of this is as included in the January 21 report:
This provides additional valuable data that ties together age (under 65), vaccination status, and presence or absence of significant underlying health conditions.
I have tabulated all of this data, where provided, between January 15 and April 13, 2022.
The only assumption I have made is that the couple of individuals who were reported as having had only one dose of a vaccine were considered (by me) to be unvaccinated. All 2,3, and 4 dose individuals are considered fully vaccinated.
The result is shown in the table below.
The table shows: Under 65 yo deaths – Jan 15 to April 13, 2022, by vaccination status and the existence of Significant Underlying Health Conditions.
Summarised, the results are:
Of 69 Vaxxed deaths, 59 (86%) had significant underlying health conditions,
Of 44 Unvaxxed deaths, 36 (82%) had significant underlying health conditions.
If 82% of the deaths in the Under-65 unvaccinated group involved significant underlying health conditions, one has to wonder how that would extrapolate into the 65-100 year old cohorts.
This data would suggest that many of the deaths in the unvaccinated cohort in total were in fact deaths which may have had little to do with vaccination status.
This is a rather excellent effort at data collection & tabulation.
good job