Disclaimer: This is not trading advice…yada yada.
A few examples of different levels of risk
| Trade Type | Risk Level |
| Shorting a small cap stock | Extreme. Unlimited losses can occur instantly. Consider example of a trading halt of a penny nasty oil company, and announcement of a major oil discovery |
| Shorting volatile mid-large cap. | High. Theoretically unlimited losses but more likely to be forced to sell when equity drops to zero |
| Shorting the broader market over a long period | High. Similar to above. |
| Buy and hold with leverage | High. Potential to lose more than initial outlay in an overnight crash |
| Buy and hold no leverage | Low. You could lose 50% but we all know MOAR |
| Swing Trading (switching between long and short) | High. It is very common to get “whipsawed”. i.e. going Long and price falls, immediately followed by shorting when price rises. |
Theoretical Swing Trading System vs S&P 500
(Note: I do not trade this system. Research only)
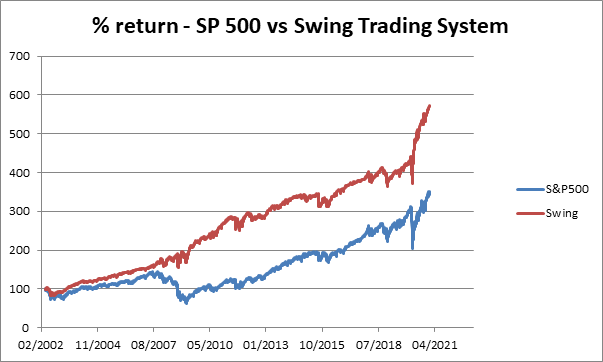
You can see the advantage of a Swing Trading System being able to make money regardless of market direction.
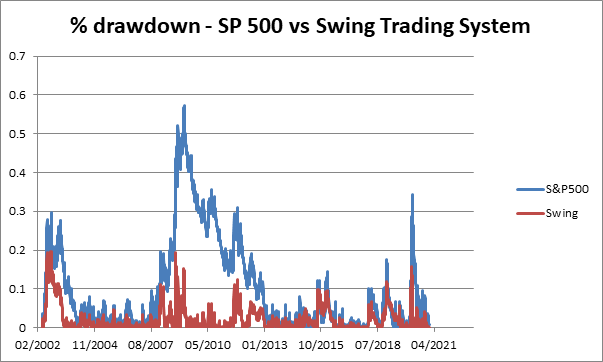
Draw your attention to the drawdowns (loss %). You will notice much smaller drawdowns in the Swing Trading system compared to the underlying market.
Change your mindset and think about how much drawdown you can tolerate. E.g. let’s say you are close to retirement and cannot afford to lose much more than 20% in a crash. Based on the 56.6% S&P500 drawdown during the GFC, you probably shouldn’t have much more than 35% invested in an S&P 500 fund. Due to smaller drawdowns in the Swing Trading System you could have closer to 100% invested in it. Disclaimer: historical performance yada yada
This brings us to something called the MAR Ratio. It is quite simply the Average Annual Return divided by the largest historical drawdown.
S&P 500 Average Return = 8.26%
S&P 500 max Drawdown = 56.6%
S&P 500 MAR Ratio = 8.26 / 56.6 = 0.146
Swing System Average Return = 11.42%
Swing System Max Drawdown = 19.4%
Swing Trading MAR Ratio = 11.42 / 19.4 = 0.588
The MAR ratio is a quick way of comparing risk-adjusted returns. In this instance the Swing Trading System has a 4 times better risk-adjusted performance compared to the underlying S&P 500. This ultimately means you can theoretically use more leverage without exceeding your maximum tolerated drawdown.
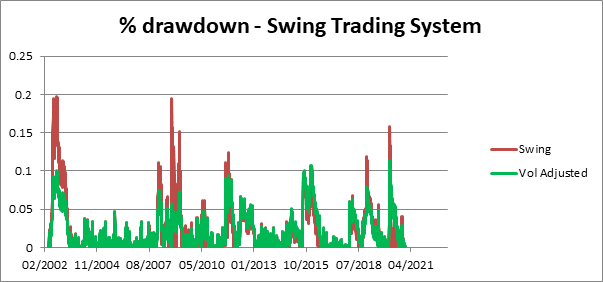
Volatility Adjusting Trades
The Swing Trading system still has a tendency to have higher drawdowns during periods of high volatility. You can reduce drawdowns by volatility adjusting trades. This simply means dividing the trade size by volatility. The formula I use to calculate volatility is a variation of the ATR formula. I use a 14 day EMA (instead of SMA) because I want some recency bias. I.e. I want it to respond quicker to a Lehmann’s insolvency, or the sudden realisation the economy will shut down during a pandemic.
A bit of trickery to convert the vol to a trade percentage. I divide a constant by this Vol calculation, with some logic to make sure it doesn’t go above 100% or below my minimum trade size.
Note that some trading systems will end up with a better MAR Ratio by volatility adjusting trade sizes. The MAR Ratio of my live trading system doubled. Not much diff with this sample trading system though.
When determining how much leverage to use, you will also need consider something called Leverage Decay.
A leveraged ETF like QQQ uses 300% leverage. If the market was to drop more than 33% without any rebalancing its price would drop to zero. Hence, there is a need to regularly rebalance the trade based on available equity. Now consider that the stock market drops 10%, they rebalance, and then the stock market rises to its previous high. On the way down you would have lost 30% (3 x 10%), and on the way back up you would have only made 7.8% (100/90 x 70%). A net loss of 6.76%. You end up with 77.8% of your original capital (a loss of 22.2%). you made 23.24% (7.78% x 3) on the way back up. A net loss of 6.76%. This is called leverage decay. Remember to include leverage in your back tests.
Note: It is actually a trading strategy to short leveraged ETFs during volatile periods.
A final tip from Trend Trader Nick Radge: After you decide on how much drawdown you think you can handle… halve it
nice guide, thanks for this freddy, it’s genuinely useful for someone learning the ropes
I made a dumbass mistake in the final calculation. It should have read you made 23.24% (7.78% x 3) on the way back up. A net loss of 6.76%.
Are the corrections made to the article accurate?
That is good. Thank you!
i haven’t had the chance to read the piece properly. Look forward to doing so
Great post. I hope you write more in the future.
Agreed – nice one Freddy!